More Jason Heyward Stats Give Reason to Be Encouraged by Early Returns
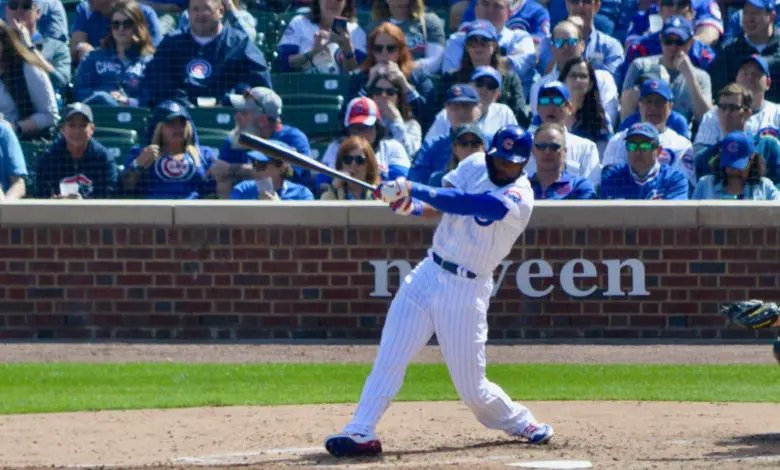
Jason Heyward continues to rake for the Cubs. On Wednesday night in Seattle, he went 3-for-4 with a run scored and an RBI to maintain his team-leading .329 batting average, not to mention his stellar .438 OBP and 17 walks. He also ranks fourth in home runs (5), behind Javier Baez (10), Willson Contreras (8) and Anthony Rizzo (7).
In a previous article, I had discussed the possibility of Heyward having a career year in home runs from the perspective of the type and quality of contact he had been making as of the first half of April. Now that a full month has gone by, I decided to follow up by taking a look at the outcomes of his plate appearances to see whether we can extrapolate home run totals for 2019 by his HR% and potential number of plate appearances.
Below is a chart of some selected ratio batting stats for Heyward’s career, courtesy of Baseball Reference.
| Jason Heyward Ratio Batting (as of 5/2/19) | ||||||||||
| Year | Age | Team | PA | HR% | SO% | BB% | XBH% | AB/HR | HR/FB% | HR |
| 2010 | 20 | ATL | 623 | 2.9 | 20.6 | 14.6 | 8.4 | 28.9 | 12.2 | 18 |
| 2011 | 21 | ATL | 456 | 3.1 | 20.4 | 11.2 | 7.5 | 28.3 | 13.0 | 14 |
| 2012 | 22 | ATL | 651 | 4.2 | 23.4 | 8.9 | 9.7 | 21.7 | 12.8 | 27 |
| 2013 | 23 | ATL | 440 | 3.2 | 16.6 | 10.9 | 8.4 | 27.3 | 10.0 | 14 |
| 2014 | 24 | ATL | 649 | 1.7 | 15.1 | 10.3 | 6.2 | 52.1 | 5.2 | 11 |
| 2015 | 25 | STL | 610 | 2.1 | 14.8 | 9.2 | 8.2 | 42.1 | 7.9 | 13 |
| 2016 | 26 | CHC | 592 | 1.2 | 15.7 | 9.1 | 5.9 | 75.7 | 3.7 | 7 |
| 2017 | 27 | CHC | 481 | 2.3 | 13.9 | 8.5 | 6.2 | 39.3 | 7.3 | 11 |
| 2018 | 28 | CHC | 489 | 1.6 | 12.3 | 8.6 | 7.2 | 55.0 | 4.7 | 8 |
| 2019 | 29 | CHC | 105 | 4.8 | 13.3 | 16.2 | 6.7 | 17.0 | 16.7 | 5 |
| Career Averages | 2.5 | 17.0 | 10.3 | 7.5 | 35.1 | 8.4 | 17 | |||
|
MLB Averages
|
2.7 | 20.3 | 8.1 | 7.7 | 32.8 | 8.2 | ||||
As you can see, Heyward has increased his HR rate to nearly 5% while also nearly doubling his walk rate to an elite-level 16.2%. His SO rate also remains well below his career average, as well as the MLB averages for his 10 major-league campaigns.
You may have noted that his percentage of extra-base hits has declined somewhat from last year’s figure and his career average. This could be the result of hitting more balls in the air, supported by his HR/FB%, which remains at the highest level of his career. Yes, even his two best home run years of 2010 and 2012.
Heyward’s AB/HR rate has also declined significantly so far this year to the lowest we have seen from him in a Cubs uniform and in his career. The other lowest prior AB/HR figure is from 2012 (21.7), when he hit a career-high 27 homers.
While we have only completed one full month of the season and are dealing with a small sample size, I think it is possible we will see Heyward ultimately post AB/HR and HR/FB% numbers similar to his 2012 season. What is even more encouraging about what Heyward is doing this year is that he is striking out less and walking more than he ever did during his best slugging years in Atlanta, making him that much more productive.
We have not seen Heyward make 600+ plate appearances in a season as a Cub and the projections available on FanGraphs have him making around 430 in 2019. However, he has already made 105 plate appearances in 2019 and it is definitely possible that he could make over 600 PA this season if he remains healthy and productive.
Below is my forecast of possible home run totals based on potential number of PAs and Heyward’s current HR% of 4.8.
430 PA: 21
500 PA: 24
550 PA: 26
600 PA: 29
650 PA: 31
Therefore, it is a distinct possibility that Heyward will post a career-high home run mark if he is able to make over 600 plate appearances this year. If that number pushes to 650, he could hit over 30 home runs.

